Last updated: 5 September 2026
TL;DR: Nine numbers tell a practice owner almost everything about their workforce: turnover, tenure, absence, overtime, unfilled shifts, freelance cover spend, holiday balance, CPD completion and incident reports. Track them monthly against the same month last year, and treat them as questions to investigate rather than as verdicts.
Most practices can tell you their monthly turnover to the pound and have no idea how many hours of overtime they paid last quarter. The clinical and financial sides get measured, the people side gets a feeling, and the feeling is usually about six months behind reality.
Because people costs are the largest line in a practice and the least measured, and HR metrics are the only way to see them. Without numbers, every staffing decision is argued on anecdote, and the person with the strongest opinion tends to win regardless of what is actually happening.
They also give you early warning. Short notice absence and overtime both move before resignations do, so a practice watching them has a quarter of notice that something is wrong.
There is a compliance angle too. HSE states that employers have a legal duty to protect employees from stress at work by doing a risk assessment and acting on it, and absence and workload data is part of the evidence behind that assessment.
Keep the purpose of your HR metrics narrow. Nine numbers reviewed monthly beats thirty reviewed never, and a practice dashboard that takes a day to produce will be produced twice.
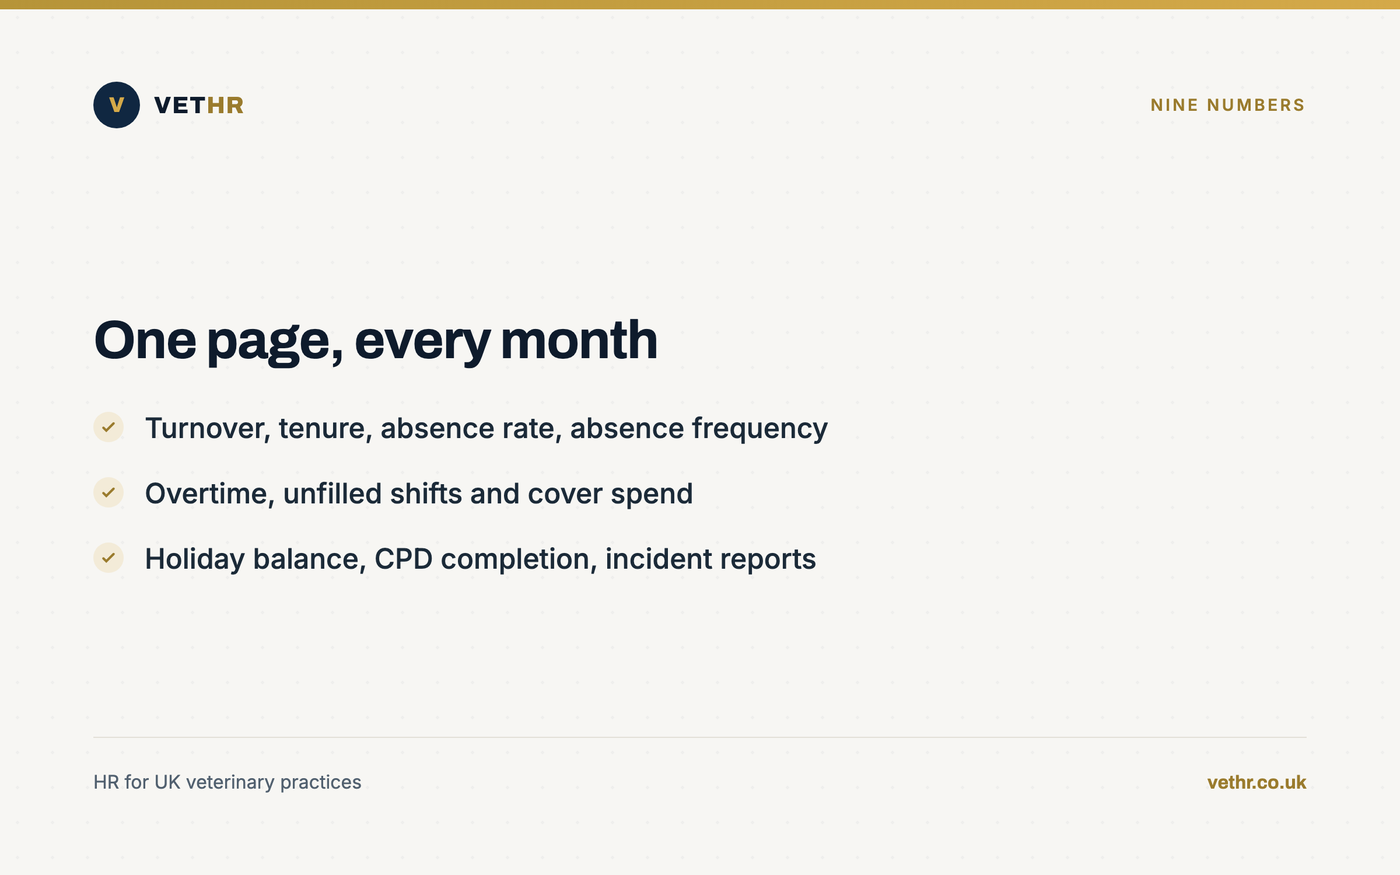
These nine HR metrics cover recruitment, retention, workload and safety without needing a dedicated analyst. Each one is a question rather than a score.
Number nine is the counter-intuitive one. More incident reports usually means better reporting culture rather than a less safe practice, which is why our See It Report It system treats a rise as a positive signal in the first year.
Number seven is the one owners underestimate. A large untaken holiday balance is a real financial liability and a reliable indicator that people cannot get time off, as our guide to holiday calculations covers.
With arithmetic simple enough to do in a spreadsheet, provided the underlying data is captured properly. The calculation is never the hard part; getting accurate hours and absence data is.
Define each measure once and write the definition down. Two people calculating the absence rate differently will produce a trend that is really a change of method, and that is the fastest way to lose confidence in HR metrics entirely.
Split turnover between regretted and unregretted leavers. A practice losing three people in a year has a very different problem depending on whether those were three experienced nurses or three probation failures.
Use episodes rather than days for short notice absence. Ten separate single days signals something quite different from one ten day absence, and only the episode count catches it, as our guide to managing sickness absence sets out.
By comparing like with like and treating every one of your HR metrics as the start of a question. Small practices produce small samples, and small samples move violently for reasons that mean nothing.
Point four matters more than it sounds. The moment staff believe absence figures are being used to build a case against individuals, the reporting behaviour changes and the data stops being worth collecting.
Share a simplified version with the team. Practices that keep HR metrics purely at owner level miss the fact that nurses often explain a strange figure in one sentence, having watched the thing that caused it happen in August.
Pair the numbers with what people tell you. A survey and a dashboard answer different questions, and together they explain far more than either does alone, as our guide to the staff survey covers.
Aggregate your HR metrics wherever possible and hold only what you need. The ICO publishes specific guidance on collecting and keeping employment records, and HR reporting sits squarely inside it.
Sickness data is special category information. A dashboard showing absence by named individual is a different proposition from one showing an absence rate by role, and it should not be circulating to anyone who does not need it.
Set a retention period for the underlying records and apply it. Practices tend to keep every monthly report indefinitely, which increases the search burden of any future request, as our guide to the subject access request explains.
No people numbers at all beyond payroll? A free 30-minute HR health check will set up the first three. Book your HR health check.
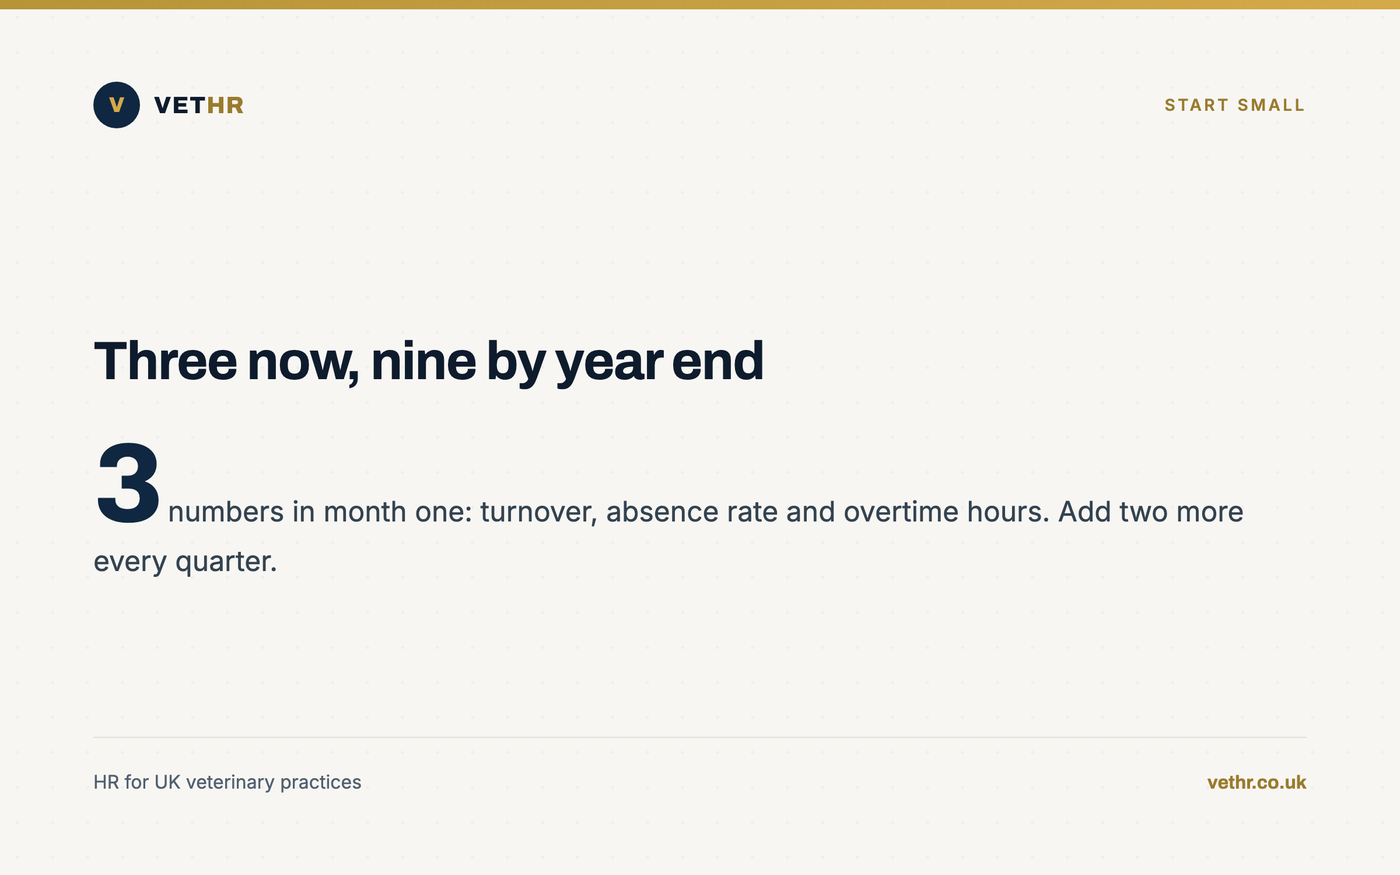
With three HR metrics and one page, this month. Practices that try to build a full dashboard in one go generally abandon it by the second quarter.
Capture the data automatically or it will not happen. Hours from a clock system, absence from the record, leave from the holiday system: anything requiring manual re-entry each month gets dropped in a busy fortnight, which is why our clock in and out system feeds this directly.
Review the HR metrics page at the same meeting every month, with a named owner. Numbers without a standing slot become numbers nobody looks at, which is how most practice dashboards quietly die.
Rather than chasing a sector benchmark, compare your practice against itself over time and split regretted from unregretted leavers. A rising rate among experienced nurses is a serious signal; the same headline figure driven by short probation exits means something entirely different.
Short notice absence frequency, measured in episodes rather than days. It moves before resignations, before overtime spikes and before anyone raises a concern, which makes it the most useful early warning available to a small practice.
Not for the arithmetic, which fits in a spreadsheet. You do need reliable underlying data on hours, absence and leave, and that is where systems earn their place, because manually re-entering figures each month is the step that always gets dropped.
You need individual records to manage absence, but keep them separate from any circulated dashboard. Sickness information is special category data, so limit access to those who genuinely need it and report aggregated figures by role or site to everyone else.
Monthly, in a standing slot, with a named owner. Compare against the same month last year rather than last month, because veterinary workload is seasonal and month on month comparisons will send you chasing changes that are simply the time of year.
People are the largest cost and the biggest risk in a veterinary practice, and in most practices they are the only part of the business running on impressions. Nine numbers on one page changes that for about an hour of setup a month.
Start with three, automate the data capture, compare year on year and treat every number as a question rather than a verdict. Our staff systems capture the underlying data and our HR consultancy helps you read it, and the free HR health check is where to start.
The Vet HR Team provides HR consultancy and white-labelled staff systems exclusively to UK veterinary practices. Handle workforce data in line with current ICO guidance.
Read next: Staff Recognition in a Veterinary Practice.
Contracts, rotas, holiday, a difficult conversation. Tell us what you are dealing with and we will come back within one working day. Nothing to sign up to.
Got it. We will come back to you within one working day. If you do not see a reply, please check your spam folder.
